finitedepth.substrate#
Analyze substrate geometry.
Module Contents#
Classes#
Abstract base class for substrate object. |
|
Analysis data for |
|
Basic implementation of substrate without any geometric specification. |
|
Abstract base class for substrate whose cross section is a simple polygon. |
|
Analysis data for |
|
Substrate having rectangular cross section. |
Functions#
|
Perform hough line accumulation. |
Attributes#
Type variable for the reference type of |
|
Type variable for |
- finitedepth.substrate.RefTypeVar[source]#
Type variable for the reference type of
SubstrateBase.
- finitedepth.substrate.DataTypeVar[source]#
Type variable for
SubstrateBase.DataType.
- class finitedepth.substrate.SubstrateBase(reference)[source]#
Bases:
abc.ABC,Generic[RefTypeVar,DataTypeVar]Abstract base class for substrate object.
Substrate object stores substrate image, which is a binary image of bare substrate acquired from
ReferenceBaseobject. The role of substrate object is to analyze the shape of the bare substrate.External API can use the following members to get analysis results of concrete subclasses.
- Parameters:
reference (RefTypeVar) – Reference instance which contains the substrate image.
- property reference: RefTypeVar[source]#
Reference instance which contains the substrate image.
- Return type:
RefTypeVar
- DataType: type[DataTypeVar][source]#
Return type of
analyze.Concrete subclass must assign this attribute with dataclass type.
- image()[source]#
Substrate image from
reference().- Return type:
numpy.typing.NDArray[numpy.uint8]
- abstract region_points()[source]#
Coordinates of points representing each substrate region.
Substrate image can have multiple disconnected substrate regions. Concrete classes should implement this method to return coordinates of points representing each region.
- Returns:
(N, 2)-shaped array, where N is the number of substrate regions. Column should be the coordinates of points in
(x, y).- Return type:
numpy.typing.NDArray[numpy.int32]
Note
These points are used to distinguish substrate regions from other foreground pixels, and give indices to each region.
As higher-level methods are expected to rely on this method, it is best to keep this method simple and independent.
- regions()[source]#
Labelled image of substrate regions.
Substrate regions are determined as connected component including a point in
region_points().- Returns:
Labelled image. Value of
irepresentsi-th region inregion_points().-1represents background.- Return type:
numpy.typing.NDArray[numpy.int8]
Note
Maximum number of regions is 128.
- contours(region)[source]#
Find contours of a substrate region.
- Parameters:
- Returns:
Tuple of the result of
cv2.findContours().- Return type:
tuple[tuple[numpy.typing.NDArray[numpy.int32], Ellipsis], numpy.typing.NDArray[numpy.int32]]
Note
Contours are dense, i.e., no approximation is made.
- class finitedepth.substrate.Substrate(reference)[source]#
Bases:
SubstrateBase[finitedepth.reference.ReferenceBase,SubstrateData]Basic implementation of substrate without any geometric specification.
- Parameters:
reference (RefTypeVar) – Reference instance which contains the substrate image.
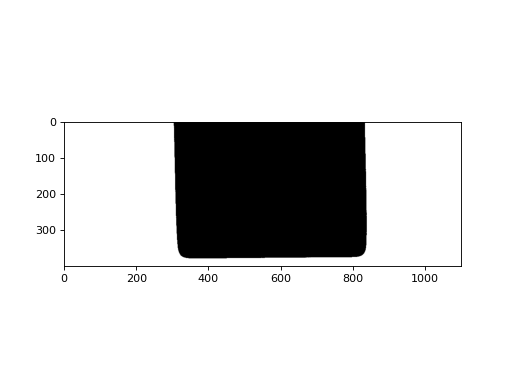
Examples
>>> import cv2
>>> from finitedepth import get_sample_path, Reference, Substrate
>>> img = cv2.imread(get_sample_path("ref.png"), cv2.IMREAD_GRAYSCALE)
>>> _, bin = cv2.threshold(img, 0, 255, cv2.THRESH_BINARY | cv2.THRESH_OTSU)
>>> ref = Reference(bin, (10, 10, 1250, 200), (100, 100, 1200, 500))
>>> subst = Substrate(ref)
>>> import matplotlib.pyplot as plt
>>> plt.imshow(subst.draw())
- DataType[source]#
Return
SubstrateData.
- region_points()[source]#
Return an upper center point of the substrate image.
Substrate ROI in reference image must be selected so that this point falls into substrate region.
- Return type:
numpy.typing.NDArray[numpy.int32]
- analyze()[source]#
Return empty
SubstrateData.
- class finitedepth.substrate.PolySubstrateBase(reference)[source]#
Bases:
SubstrateBase[RefTypeVar,DataTypeVar]Abstract base class for substrate whose cross section is a simple polygon.
A simple polygon does not have intersection nor hole [1]. Smooth corners are allowed.
- Parameters:
reference (RefTypeVar) – Reference instance which contains the substrate image.
Note
- Substrate image should not have:
Multiple substrates in one image
Multiple contours (e.g. substrate with holes)
- abstract property sigma: float[source]#
Standard deviation of gaussian filter to smooth the noise in contour.
- Return type:
- abstract property hough_parameters: tuple[float, float, int][source]#
Parameters for Hough line transformation.
- region_points()[source]#
Return an upper center point of the substrate image.
Substrate ROI in reference image must be selected so that this point falls into substrate region.
- Return type:
numpy.typing.NDArray[numpy.int32]
- vertices()[source]#
Find
n()vertices of the polygon.A vertex is a point where two sides of a polygon meet [2]. When the sides are curves, the vertices are defined as local extrema of curvature [3].
The vertices are found by smoothing
contour()withsigmaand finding the local extrema of curvature [4].- Returns:
Indices of the vertex points in
contour().- Return type:
numpy.typing.NDArray[numpy.int32]
- sides()[source]#
Find
n()sides of the polygon.The sides are found by slicing
contour()byvertices().- Returns:
Tuple of array containing points on each side of the polygon contour. The arrays are sorted so that the side containing the first point of the contour comes first.
- Return type:
tuple[numpy.typing.NDArray[numpy.int32], Ellipsis]
Note
Sides can be noisy and curved. Use
sidelines()to get linear models.The term “side” is used instead of “edge” to avoid confusion from other image processing methods (e.g. Canny edge detection).
- sidelines()[source]#
Find
n()sidelines of the polygon.Sideline is the line that contains one side of the polygon [5]. The sidelines are found by performing Hough line transformation on
sides()withhough_parameters.- Returns:
Vector of line parameters in \((\rho, \theta)\). \(\rho\) is the distance from the coordinate origin. \(\theta\) is the angle of normal vector from the origin to the line.
- Return type:
numpy.typing.NDArray[numpy.float32]
Note
Range of angle is \(\theta \in (-\frac{3 \pi}{2}, \frac{\pi}{2}]\). Arctangent direction can be acquired by \(\theta + \frac{\pi}{2}\).
- sideline_intersections()[source]#
Find intersections of
sidelines().- Return type:
numpy.typing.NDArray[numpy.float32]
- finitedepth.substrate.houghline_accum(rho_array)[source]#
Perform hough line accumulation.
- Parameters:
rho_array (numpy.typing.NDArray[numpy.int32]) – Array containing rho and theta values for every points. The shape must be
(P, T), wherePis the number of points andTis the numbers of digitized theta intervals.- Returns:
Tuple of accumulation matrix and detected
(rho, theta_idx)value.- Return type:
- class finitedepth.substrate.RectSubstData[source]#
Analysis data for
RectSubstrate.- Parameters:
Width – Width of the rectangular cross section in pixels.
- class finitedepth.substrate.RectSubstrate(reference, sigma, rho_thres, theta_thres, hough_step=1)[source]#
Bases:
PolySubstrateBase[finitedepth.reference.ReferenceBase,RectSubstData]Substrate having rectangular cross section.
- Parameters:
reference (finitedepth.reference.ReferenceBase) – Reference instance which contains the substrate image.
sigma (float) – Standard deviation of gaussian filter to smooth the noise in contour.
rho_thres (float) – Hough line transformation parameters.
theta_thres (float) – Hough line transformation parameters.
hough_step (int) – Hough line transformation parameters.
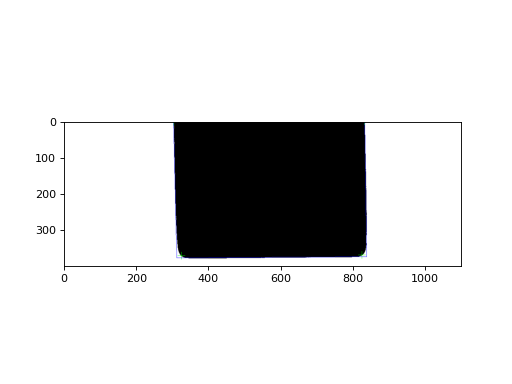
Examples
>>> import cv2
>>> from finitedepth import get_sample_path, Reference, RectSubstrate
>>> img = cv2.imread(get_sample_path("ref.png"), cv2.IMREAD_GRAYSCALE)
>>> _, bin = cv2.threshold(img, 0, 255, cv2.THRESH_BINARY | cv2.THRESH_OTSU)
>>> ref = Reference(bin, (10, 10, 1250, 200), (100, 100, 1200, 500))
>>> subst = RectSubstrate(ref, 3.0, 1.0, 0.01)
>>> import matplotlib.pyplot as plt
>>> plt.imshow(subst.draw())
- property hough_parameters: tuple[float, float, int][source]#
Hough line transformation parameters passed to the constructor.
- DataType[source]#
Return
RectSubstData.
- analyze()[source]#
Return
RectSubstData.
- draw(mode='image', vertice_color=(0, 255, 0), vertice_thickness=1, vertice_markerSize=20, sideline_color=(0, 0, 255), sideline_thickness=1)[source]#
Draw substrate image and show vertices and sidelines.
- Parameters:
mode ({‘image’, ‘contour’}) – Draw mode. ‘image’ draws
image(), while ‘contour’ drawscontour().vertice_color (tuple[int, int, int]) – Vertice marker color for
cv2.drawMarker().vertice_thickness (int) – Vertice marker thickness for
cv2.drawMarker().vertice_markerSize (int) – Vertice marker size for
cv2.drawMarker().sideline_color (tuple[int, int, int]) – Sideline color for
cv2.line().sideline_thickness (int) – Sideline thickness for
cv2.line().
- Return type:
numpy.typing.NDArray[numpy.uint8]